Scanners
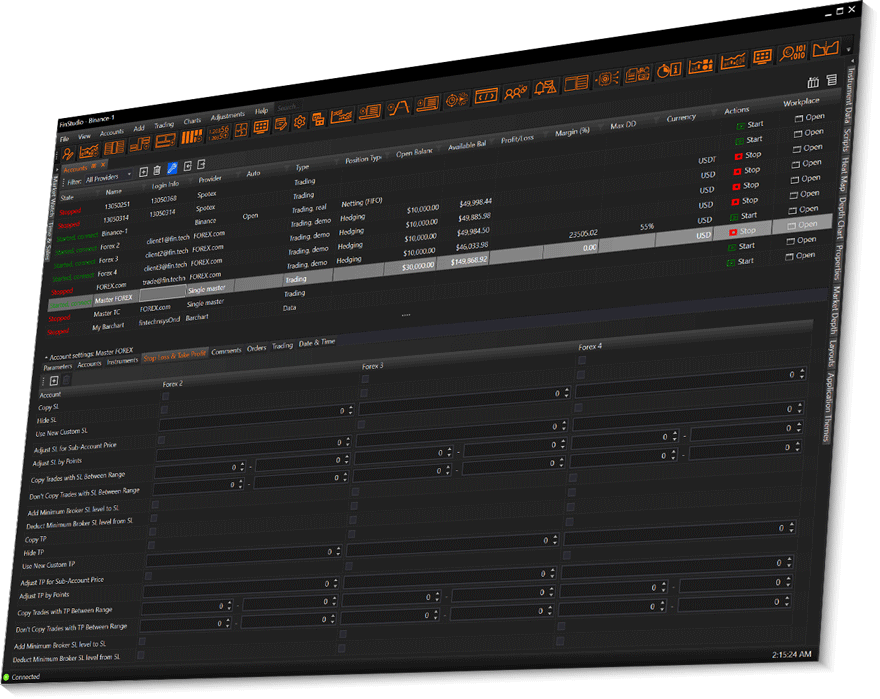
Accounts & Connection Management
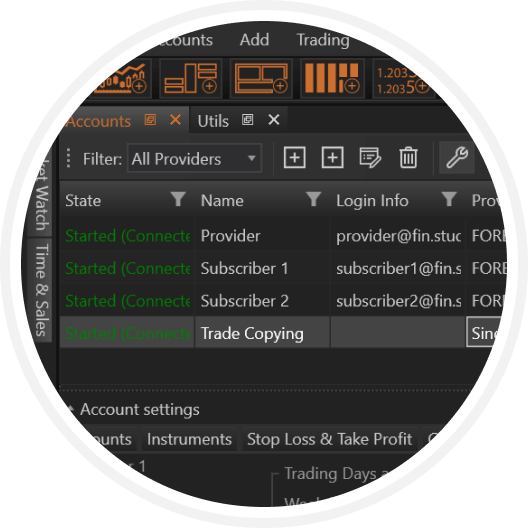
Accounts & Connection Management — a clean, professional hub to plug in brokers/exchanges fast, spin up Trading, Data, or Virtual (PAMM/LAMM) accounts, and view crypto & fiat balances with instant reference values. Work in safe, isolated Workplaces, manage everything from the Accounts Grid (status, P/L, margin, start/stop), and rely on built-in Risk Controls like Maximum Drawdown to auto-close and pause when needed. Simple, steady, and ready—so every other FinStudio module can pull data and place trades seamlessly.
-
Accounts
Create and manage Trading or Data accounts for any supported provider. Enter credentials (login/password or API keys), connect, and you’re live. Each account can open in its own Workplace so multi-account setups stay clean and organized.
-
Balances
Get a consolidated view of assets—especially useful for crypto wallets that hold multiple coins. Toggle values into your preferred reference currency (e.g., USD or ETH) for instant net-worth snapshots.
Data Management & Analysis
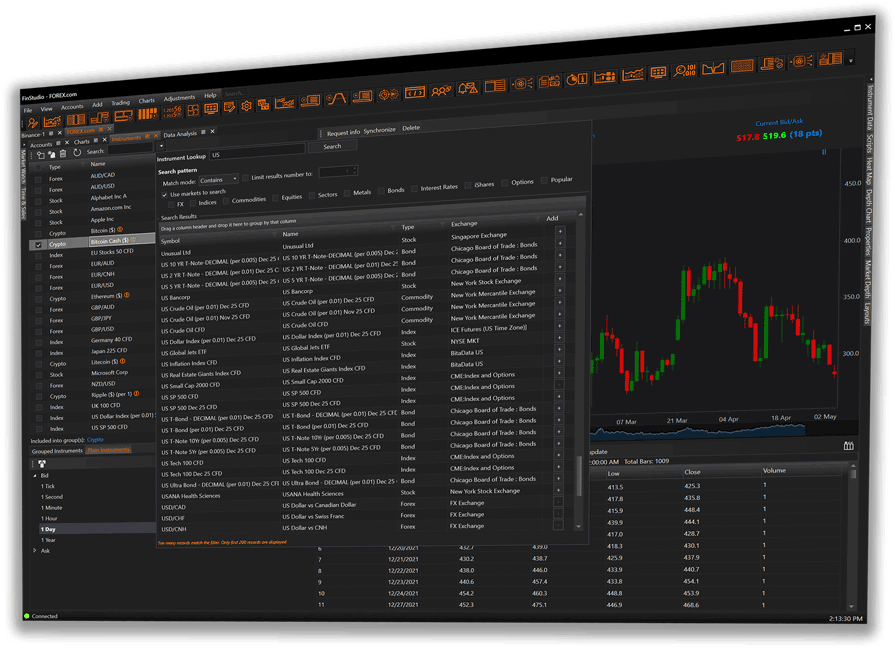
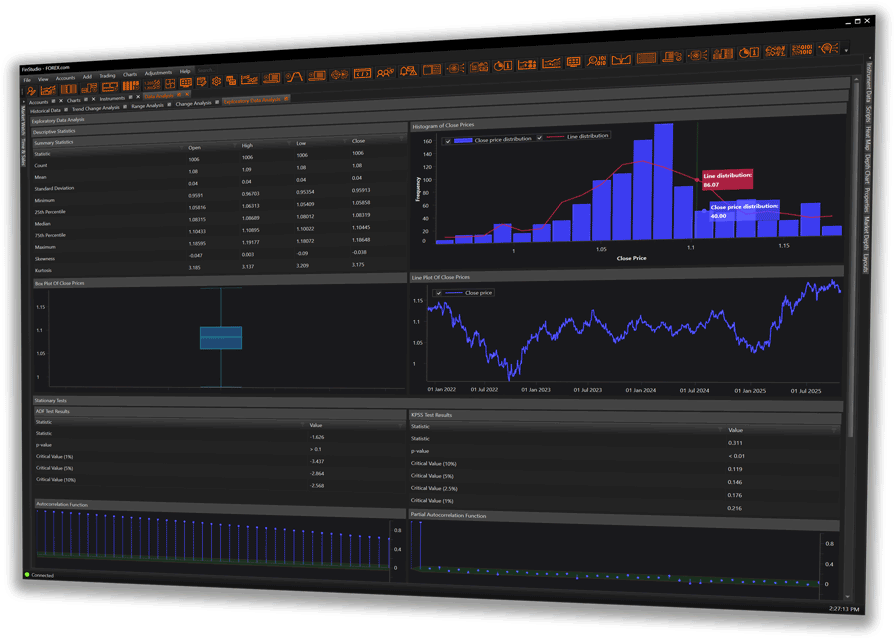
Data Management & Analysis — organize symbols, control storage, and turn history into insight. Add and group Instruments, import/download historical data (from ticks to Level II), and optimize disk use with on-the-fly aggregation. See every instrument’s trading specs in Instrument Data (tick/point size, swaps, order limits) so orders and charts behave exactly as expected. When you’re ready to learn from the past, open Data Analysis for fast historical stats, trend/up-down streaks, range/volatility by hour/day/month, and open-to-close change—exportable and ready for strategy design.
-
Instruments
Instruments — manage every tradable symbol in one place: build reusable lists/groups, control stored data (Bid/Ask/Last or full Level II) with predefined or custom periods, and import history (provider/CSV) with fast, compressed storage and on-the-fly aggregation.
-
Instrument Data
Instrument Data — your single source of trading specs, showing (and where allowed editing) tick/point size & value, precision, swaps, min/max order sizes, distance rules, and exchange info in one Properties pane for accurate sizing and valid orders.
-
Data Analysis
Data Analysis — turn history into evidence with quick runs of Historical Stats, Trend Change, Range by hour/day/month/year, and Open-to-Close change—using custom intervals, tabular summaries, and exports to validate timing, volatility windows, and biases before you build.
Price Monitoring
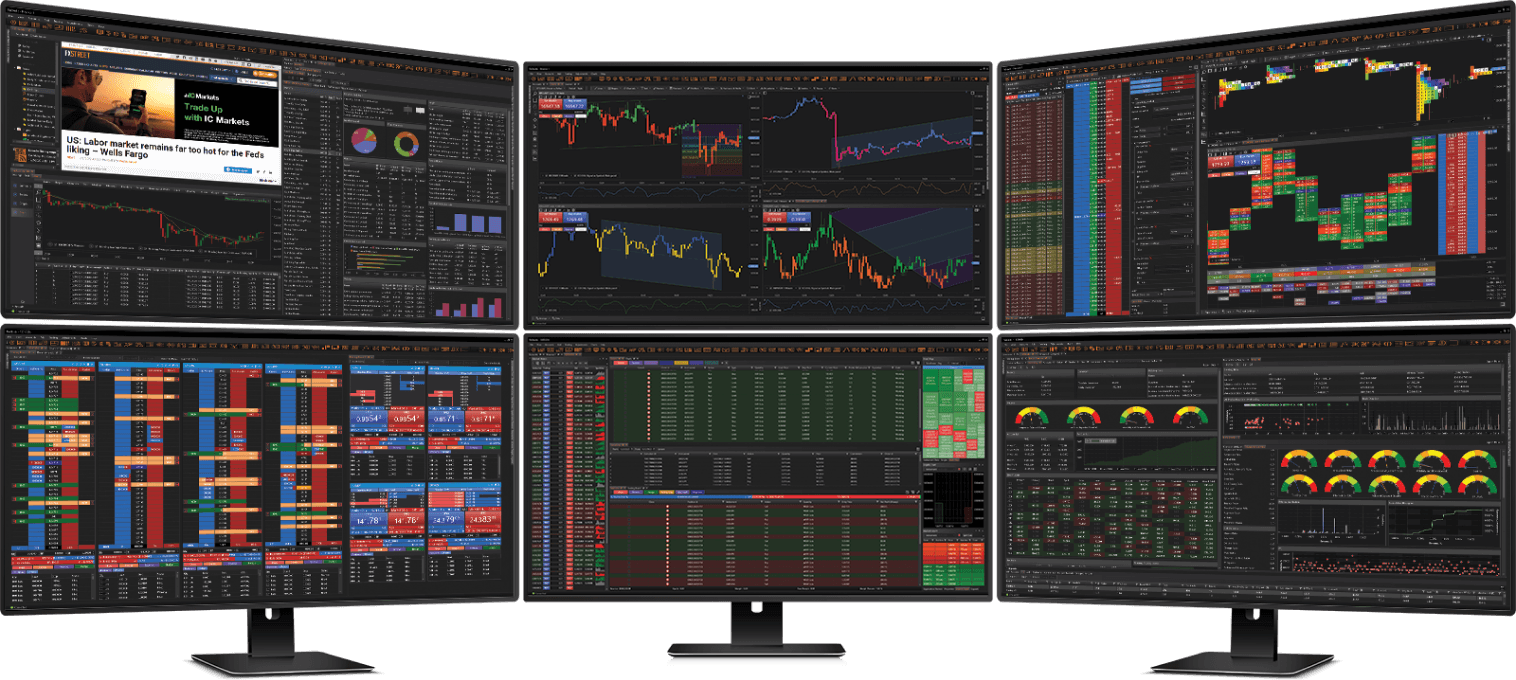
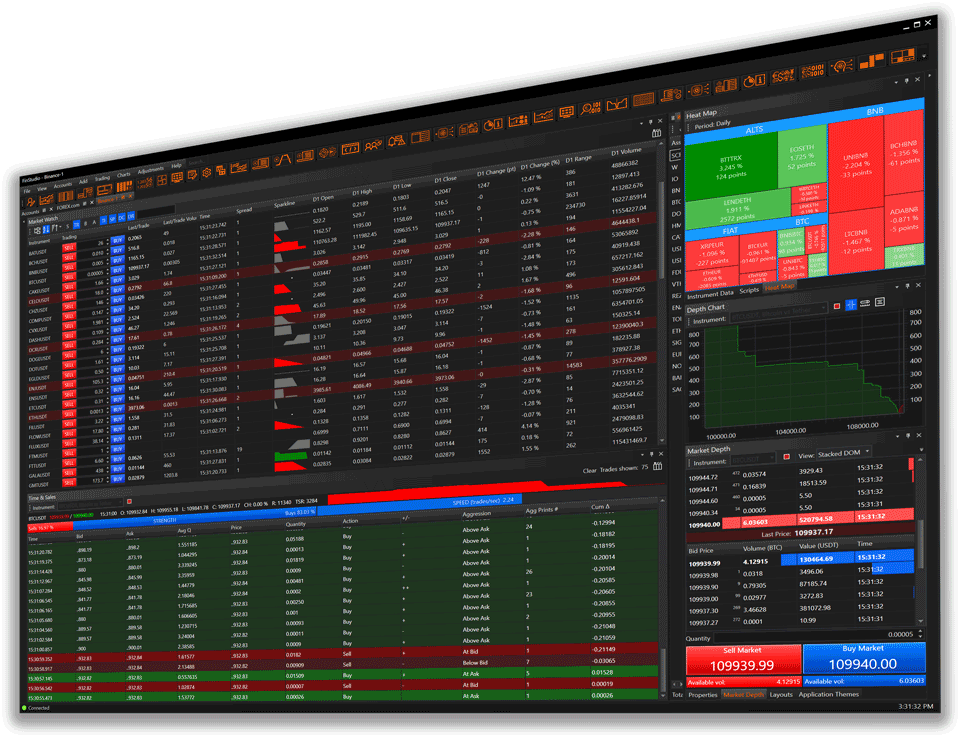
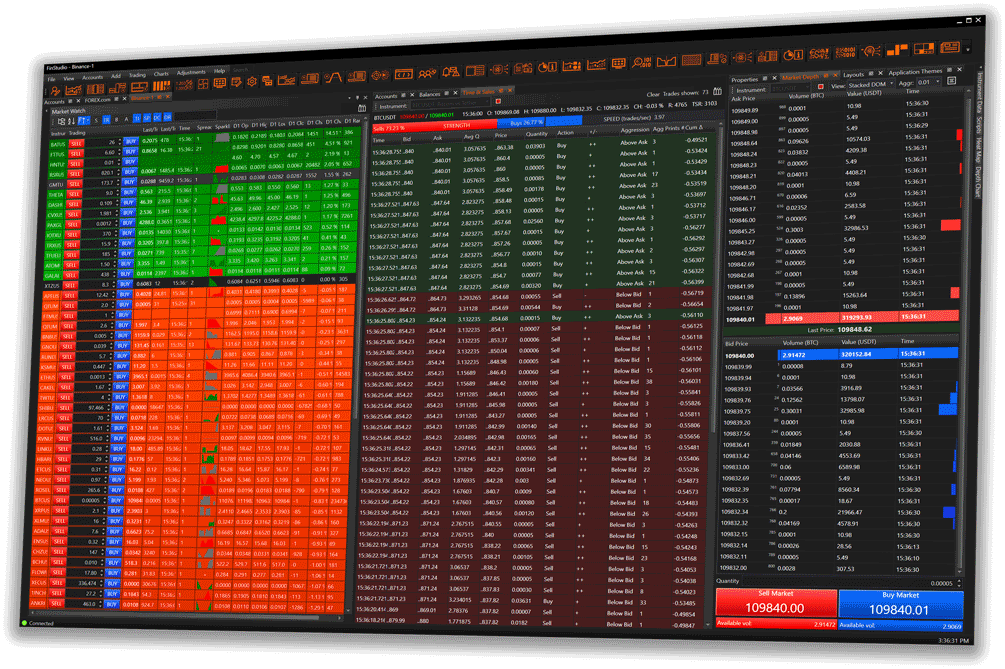
Price Monitoring — track price action and liquidity in real time, with context you can act on. Scan quotes in Market Watch, follow prints in Time & Sales, and read the book with Market Depth to see where orders stack and disappear. Quickly spot momentum bursts and rotation with Market Heatmap, then verify and study behavior using Historical Depth of Market & Sales to replay microstructure around key moves. Everything is fast to navigate, exportable where it matters, and one click away from your charts or tickets—so you can confirm, decide, and execute with confidence.
-
Market Watch
A fast, customizable quote board that lets you scan movers across day/week/month/year horizons with rich predefined and custom columns, color cues, grouping and gainers/losers sorting, plus conditional alerts—so the most important instruments surface instantly while you stay in flow.
-
Time & Sales
Per-trade prints with context—backed by Summary/Strength/Speed panels, smart aggregation, and granular filters—so you can read momentum versus noise, track block activity, and adjust history/update settings to keep heavy flows smooth and legible.
-
Market Depth
Live Level II in four clear views—Price DOM, Stacked DOM, Bids Only, and Asks Only—with tailored columns for time/price/volume/value, quick size entry and Sell/Buy Market buttons, and last-price and available-volume cues to keep action and context aligned.
-
Market Heatmap
A color- and size-coded snapshot of the market where blocks reflect change, range, or volume across flexible periods with adjustable refresh, letting themes, rotations, and outliers jump out while you fine-tune focus and appearance in Properties.
-
Historical Depth of Market & Sales
A synchronized replay of archived order-book snapshots alongside historical prints, designed for post-event forensics and hypothesis checks, with selective loading and filters that keep large datasets responsive while you study how liquidity and trades shaped key moves.
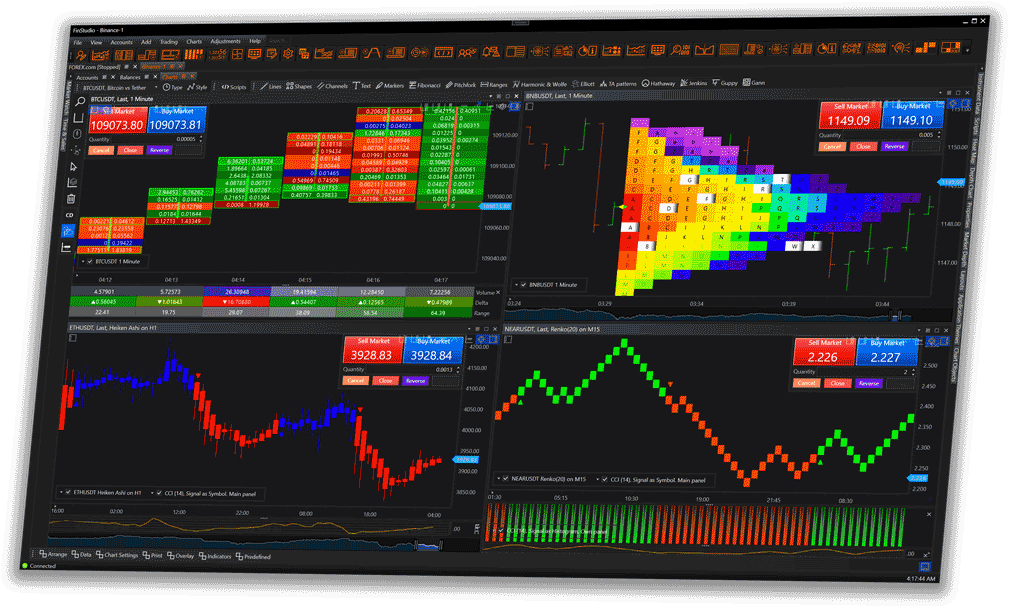
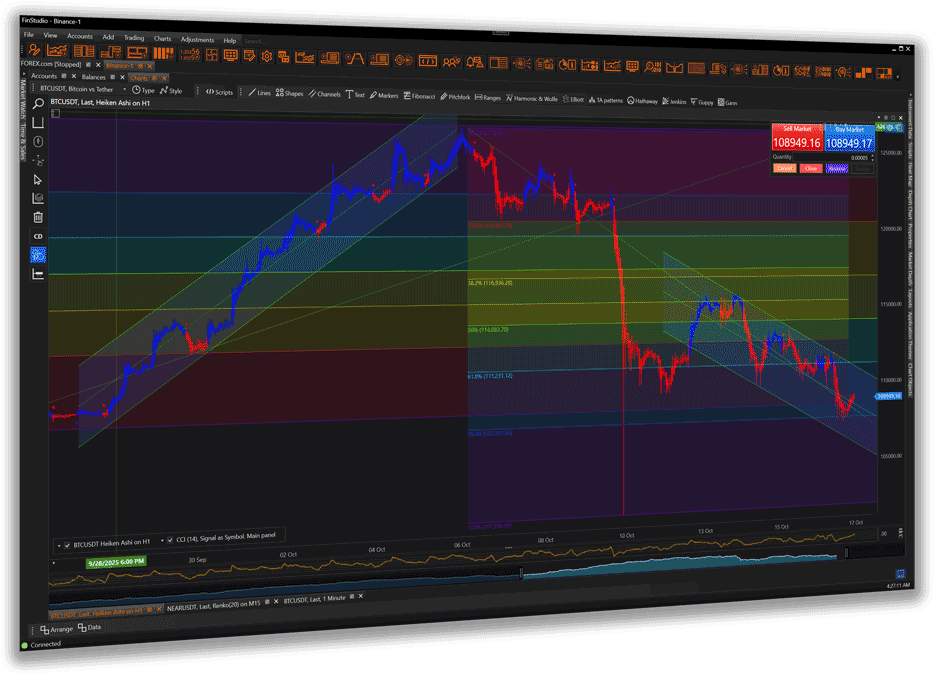
Charting
Charting — build clean, responsive views for any market and timeframe. Start with Charts for multi-window layouts, linked symbols/timeframes, templates, and a rich library of indicators and overlays. Draw with Chart Objects—trendlines, channels, Fibs, notes, and more—with precise snapping and editable properties for pixel-perfect analysis. When you want speed and focus, switch to Simple Chart for a lightweight, minimal UI; when you need order-book context, use Depth Chart to visualize bids/asks and cumulative imbalance alongside price. Smooth to pan/zoom, easy to save/share, and tuned for fast decision-making.
-
Charts
Charts — the backbone of FinStudio charting: high-performance visuals, deep analysis tools, and direct trading in one place. Handle massive datasets smoothly (up to multi-billion points), switch across standard and special periods (tick→year, custom intervals, Heiken Ashi, Renko, Kagi, Point & Figure), and work with 100+ drawing tools. Programmable actions and exit methods keep analysis, orders, and risk tightly integrated.
-
Chart Objects
Chart Objects — one panel to see and manage everything on your chart. Browse all indicators and drawing tools in a categorized list, toggle visibility, lock items, and jump straight to properties for quick edits—keeping complex workspaces tidy and fast.
-
Simple Chart
Simple Chart — a lean, high-speed chart for pure price action. Strips out heavy overlays and trading panels to maximize responsiveness—ideal for large histories, lower-spec machines, or a clean learning view.
-
Depth Chart
Depth Chart — a standalone, real-time view of order-book supply/demand. See aggregated bids vs. asks and cumulative volume to spot liquidity walls, spreads, and imbalances at a glance; tune colors, scales, and update rates to your market.
Trading
Trading — place, manage, and execute with precision from one workspace. Send Orders (market/limit/stop, OCO/brackets, partials) from tickets, charts, or hotkeys; modify/cancel in-line with immediate feedback. Track Positions in real time with P/L, margin, exposure, and handy actions like scale, hedge, reverse, or flatten. Audit fills in Executions with timestamps, price/size, and venue details. Use Trading Board for multi-ticket workflows and quick batching across symbols or accounts. When microstructure matters, trade on Depth of Market & Sales—read the ladder, watch the tape, and click to place/adjust orders at exact price levels. Everything is fast, consistent, and built to keep you in control.
-
Orders
Orders — your control room for the order lifecycle. Monitor Working / Partially Filled / Filled / Cancelled / Rejected in real time, group by instrument or type, and work faster with batch ops. Create advanced setups with OCO/OSO and see potential P/L for stops/limits before they trigger.
-
Positions
Positions — live exposure at a glance with powerful actions. Close, partial close, reverse, or hedge in one click; project best/worst outcomes from attached SL/TP; and automate rules (e.g., trailing stop, close on net P/L, time). Detailed columns include P/L (money/points/%), MAE/MFE, and costs.
-
Executions
Executions — a clean, auditable fill log. Every execution carries an ID, timestamp, price, quantity, and fees, cross-referenced to the original order for full lifecycle traceability—ideal for post-trade checks and broker reconciliation.
-
Trading Board
Trading Board — Trade Panel + DoM in one fast window. Hit Buy/Sell instantly, place OCO/OSO, and use TWAP to slice large orders. See Position & P/L bars, quick Close/Cancel/Reverse/Hedge actions, and pop out panels to other screens; attach a chart inline when you need context.
-
Depth of Market & Sales
Depth of Market & Sales — an extended DoM with integrated tape. Add columns for sales, cumulative volume, or delta; keep bids/asks clearly separated; and read real-time prints alongside the ladder for granular order-flow insight—while retaining one-click placement and DoM actions.
Scanners
Scanners — pattern detection you can trust. Scan markets with Candlestick and Chart Pattern engines grounded in Bulkowski’s research, running real-time for fresh signals and historical for proof. Go beyond names with rich statistics—win rates, continuation vs. reversal, measure-rule target success, and performance over 1/3/5/10 bars—so you rank what actually works before you act.
-
Scanner
Scanner — run one analyzer for both Candlestick and Chart Pattern detection, in real time or on history. Pick your pattern sets and timeframe, then review Current (live) and Completed (closed) patterns with objective rankings so you focus on signals that have evidence behind them.
- Two engines: Candlesticks (100+ formations) and Chart Patterns (H&S, triangles, doubles, harmonics, etc.).
- Real-time + backtest: Detect on close, then validate on history with identical logic.
- Evidence first: Win rate, reversal/continuation mix, target-hit stats, and performance over 1/3/5/10 bars.
- Views: Current Patterns (live signals) and Completed Patterns (outcomes with stats).
- Configurable analyzer: Choose pattern sets, inputs, entry/exit rules, and ranking horizon.
Builders
Builders — create strategies your way: visually with Manual Strategy Builder (MSB) or autonomously with Automatic Strategy Builder (ASB). In MSB, design logic with inputs, members, drawings, and drag-and-drop algo blocks (OnBarUpdate)—then auto-generate code for precise, rule-based trading without writing it by hand. With ASB, let machine learning & genetic algorithms explore indicators, candlestick/chart patterns, exit signals, and money-management to evolve and filter top performers under realistic brokerage settings—storing only strategies that meet your fitness metrics. When you’re ready, review results and export the best systems as source code for further refinement or deployment.
-
Manual Strategy Builder
Manual Strategy Builder (MSB) — build rule-based strategies visually, no coding required. Define Inputs, Members (e.g., indicator refs), and Drawings, then assemble logic with drag-and-drop Algo blocks inside OnBarUpdate. MSB saves projects as templates, auto-generates source code you can compile or fine-tune in the Code Editor, and supports rich operands (constants, indicator values, bind expressions, bar/market prices) plus elements for Conditions, Trade/Code/Visual actions. Run what you build in the Backtester or Strategy Runner.
-
Automatic Strategy Builder
Automatic Strategy Builder (ASB) — let machine learning & genetic algorithms create and evolve strategies automatically. You choose building blocks (indicators, candlestick/chart patterns, exit signals), money management, data, and ranking rules; ASB generates candidates, backtests them, filters by your metrics, and stores only the best. Track generations and fitness in real time, then export source code or deploy in Strategy Runner. Brokerage settings (slippage, commissions, leverage, stop-out) keep results realistic.
Autotrading
Autotrading — validate, optimize, and run strategies end-to-end. Use Backtester to simulate performance on historical data with multi-strategy, multi-instrument/timeframe testing, realistic money management, built-in exit signals, and genetic optimization to discover robust parameter sets. Then switch to Strategy Runner to launch and monitor strategies in real time—start/stop, tweak parameters on the fly, and add per-trade Trade Algos for advanced exits and partials—keeping execution organized and controlled from a single screen.
-
Backtester
Backtester — simulate strategies on historical data with realistic assumptions and clear, repeatable results. Run single or multiple strategies across multiple instruments/timeframes, apply commissions, slippage, leverage, and stop-out, and use built-in Money Management and Exit Signals to mirror how you trade. Explore robust settings with genetic optimization and train/test splits, then review outcomes in Trade Analysis or export runs for comparison.
-
Strategy Runner
Strategy Runner — take tested systems live (or paper) with tight control. Start/stop strategies, tune parameters on the fly, and attach per-trade Trade Algos for advanced exits and partials—all from a single screen that tracks status, P/L, errors, and logs. Safety rails help you pause or halt when limits hit, keeping execution clean and predictable.
FinScript
FinScript — your programmable edge in FinStudio. Write custom Indicators, Strategies, Money Management, Trade Exit Signals, Candlestick/Chart Patterns, and even Bar Types in a C#-based framework that taps the full .NET ecosystem. Build and debug in the integrated Code Editor with wizards, syntax highlighting, and error/output panels, then manage compiled components in Scripts for quick reuse and tuning. Clean lifecycle hooks (e.g., OnBarUpdate, OnCalculate, OnOrderUpdate) and rendering overrides let you shape logic and visuals precisely—so you can move from idea to robust, production-grade tooling without leaving the platform.
-
FinScript
FinScript — FinStudio’s C#-based scripting framework for building Indicators, Strategies, Money Management, Trade Exit Signals, Candlestick/Chart Patterns, and Bar Types—all first-class, plug-and-play components in the platform. It’s modular, .NET-friendly, and built to run across charts, the Backtester, and Strategy Runner.
-
Code Editor
Code Editor — an IDE-style environment dedicated to FinScript with Solution Explorer, editor, and Output/Errors panels. Scaffold new components via Wizards, build in Debug/Release, and open projects in Visual Studio / VS Code when needed.
-
Scripts
Scripts — the central browser for compiled FinScript components. Organize libraries, import new scripts, search, and drag onto charts; properties show up immediately for quick tuning.
Trade Analysis
Trade Analysis — turn raw results into decisions. Start with Trades for a clean grid of closed positions (entry/exit, P/L, holding time, costs) to audit what happened. Move to Result Analysis for deep performance intelligence—Summary, Returns, Risk (drawdowns, VaR/CVaR, risk-of-ruin), Instruments, Time/Period breakdowns, Benchmarks, plus Reports Correlation, Portfolio Builder, and Monte Carlo to stress-test and optimize strategy mixes. For indicator-driven workflows, Signal Performance Info measures buy/sell signals over history—counting trades, net P/L, drawdowns, and hit rates—so you know which signals actually pay. Data-driven, configurable, and built to refine what you run next.
-
Trades
Trades — your definitive ledger of what actually happened. Review every closed (and closing) position with precise entry/exit timestamps, prices, quantities, and costs, then see the impact in money, points, and percent. Sort, filter, and group to spot patterns in winners vs. losers, short vs. long, or by strategy/account. With clean exports and consistent color cues, it’s the fastest way to audit results and sanity-check executions before diving deeper.
-
Result Analysis
Result Analysis — turn performance into insight. Start with a high-level summary, then drill into returns, drawdowns, and risk to understand how a system behaves across markets and time. Break results down by instrument and period (hour/day/month), compare to benchmarks, measure report correlations to avoid overlap, assemble portfolios, and stress-test with Monte Carlo. The goal: a realistic view of robustness before capital goes live.
-
Signal Performance Info
Signal Performance Info — prove a signal before you trust it. Analyze buy/sell triggers from indicators or patterns over history to see hit rates, average outcomes, and drawdowns—plus how results evolve 1/3/5/10 bars after each signal. Filter by instrument and timeframe to isolate where a signal actually works, then export the evidence for strategy design or risk sign-off.
Media Feeds
Media Feeds — stay informed without leaving FinStudio. Follow custom RSS Reader folders and smart feeds for fast headline scanning and in-app reading; consume provider-delivered content in News Reader with an email-style list and article view; open research and portals inside the built-in Web Browser with favorites/presaved pages; and plan around macro events using the Economic Calendar grid (Event, Time, Country, Actual/Forecast/Previous, revisions) with provider-selectable data sources. One streamlined space for news, web, and macro—keeping your workflow focused and current.
-
RSS Reader
RSS Reader — subscribe, organize, and read feeds without leaving FinStudio. Use folders and Smart Feeds (Today, All Unread, Favorites) to scan fast, preview full articles in-app, and fine-tune update intervals and display in Properties.
-
News Reader
News Reader — provider-managed news inside FinStudio. Brokers/news vendors supply the feeds; you get an email-style News List and News View with optional alerts, history, and appearance/refresh settings.
-
Web Browser
Web Browser — a built-in browser to keep research in context. Navigate with address bar and back/forward/refresh, open provider presaved pages and favorites, and theme the toolbar to match your workspace.
-
Economic Calendar
Economic Calendar — a consolidated grid of macro events (data releases, central bank, holidays) with columns for Event, Country, Event Time, For, Actual, Expectation, Previous, Revised From. Providers can swap in their own data source.
Logs & Notifications
Logs & Notifications
Logs & Notifications — centralize signal awareness and system health. Alerts aggregates notifications from indicators, strategies, and system checks into one table (Local Time, Signal, Indicator, Message) with optional sound, popup, and email—all theme-tunable for high visibility. For deeper diagnostics, Log Viewer captures Trace/Debug/Info/Warning/Error messages with filtering, sorting, real-time updates, and export so you can spot issues fast and keep operations smooth.
-
Alerts
Alerts — a centralized table for all triggered notifications from across FinStudio (indicator signals, strategy triggers, system conditions). New alerts land here in near real-time, with optional sound, popup, and email so you don’t miss critical events. Columns keep each entry clear: Local Time, Signal, Indicator, and Message, plus flags for Sound/Popup/Mail.
-
Log Viewer
Log Viewer — your system-wide diagnostics console. It aggregates messages from strategies, indicators, data providers, and connections, categorized by Trace / Debug / Info / Warning / Error for quick filtering and troubleshooting. Supports real-time updates, sorting/grouping, search, copy/export, and customizable appearance.
UI & UX
-
Settings
Settings — app-wide preferences in one place: general behavior, charts, layouts, email, hotkeys, data storage, and file paths. Configure outgoing mail for alerts/reports, remap critical shortcuts, control what historical/real-time data gets saved (incl. Level II), and review install/content directories for backup or migration.
-
Properties
Properties — a context-aware panel for live, module-specific tweaks. It updates to whatever you select (Chart, Trading Panel, etc.), can be docked/undocked, and often includes a Theme tab for local styling that can override the global theme—ideal for fine control without modal pop-ups.
-
Application Themes
Application Themes — full visual control across FinStudio: colors, fonts, and styles via Themes and Palettes tabs. Tweak windows, menus, toolbars, tables, buttons, sparklines, indicator/graph defaults, and assign chart palettes—reduce eye strain, align branding, and keep visuals consistent.
-
Layouts
Layouts — save and switch entire workspace arrangements (what’s open, where it’s docked, sizes). Perfect for task- or account-specific setups; import/export for teams; star favorites for one-click switching from the top toolbar.
-
Templates
Templates — one-click, reusable internal configurations for modules (e.g., a chart profile with indicators/palettes/timeframes or a Trading Board setup). Use alongside Layouts: layouts place modules; templates define how each module is configured inside.